canturan.dev
A lightweight monitor that watches Windows and Linux servers across locations from one dashboard
- Sector
- Personal brand
- Country
- Türkiye
- Category
- Custom software
- Services
- Custom software
- Technology
- Go, React 19, TypeScript, Vite, Recharts, SQLite, Tailscale, Docker, Apache Guacamole, Web Push
01 /
The brief
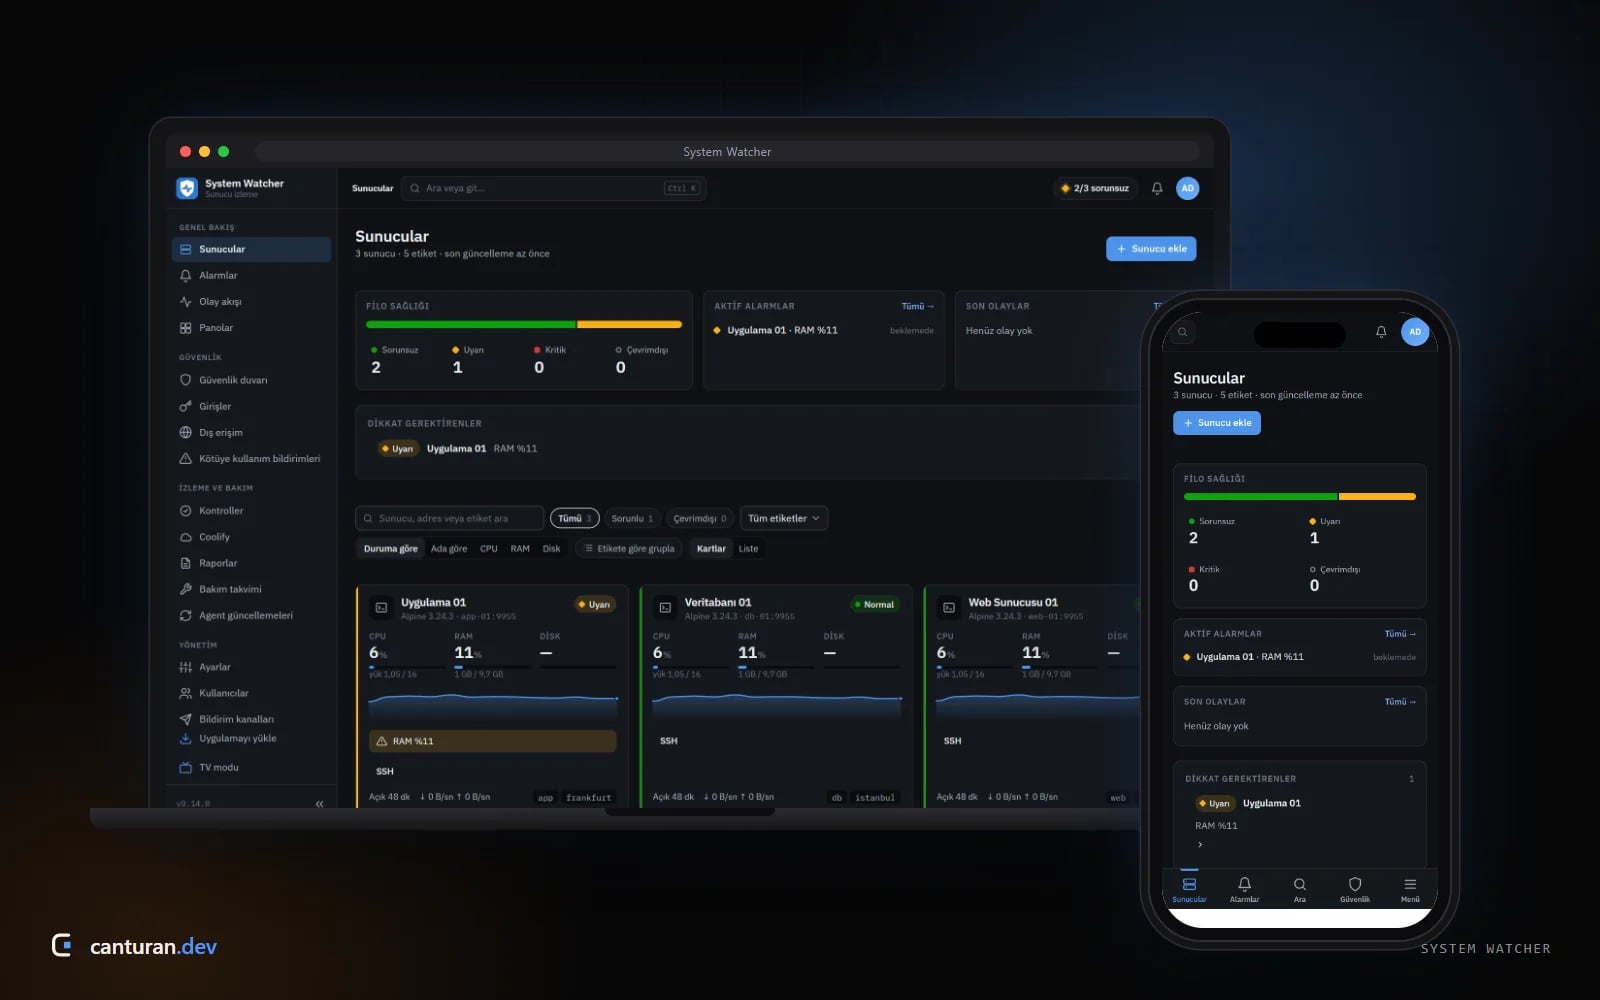
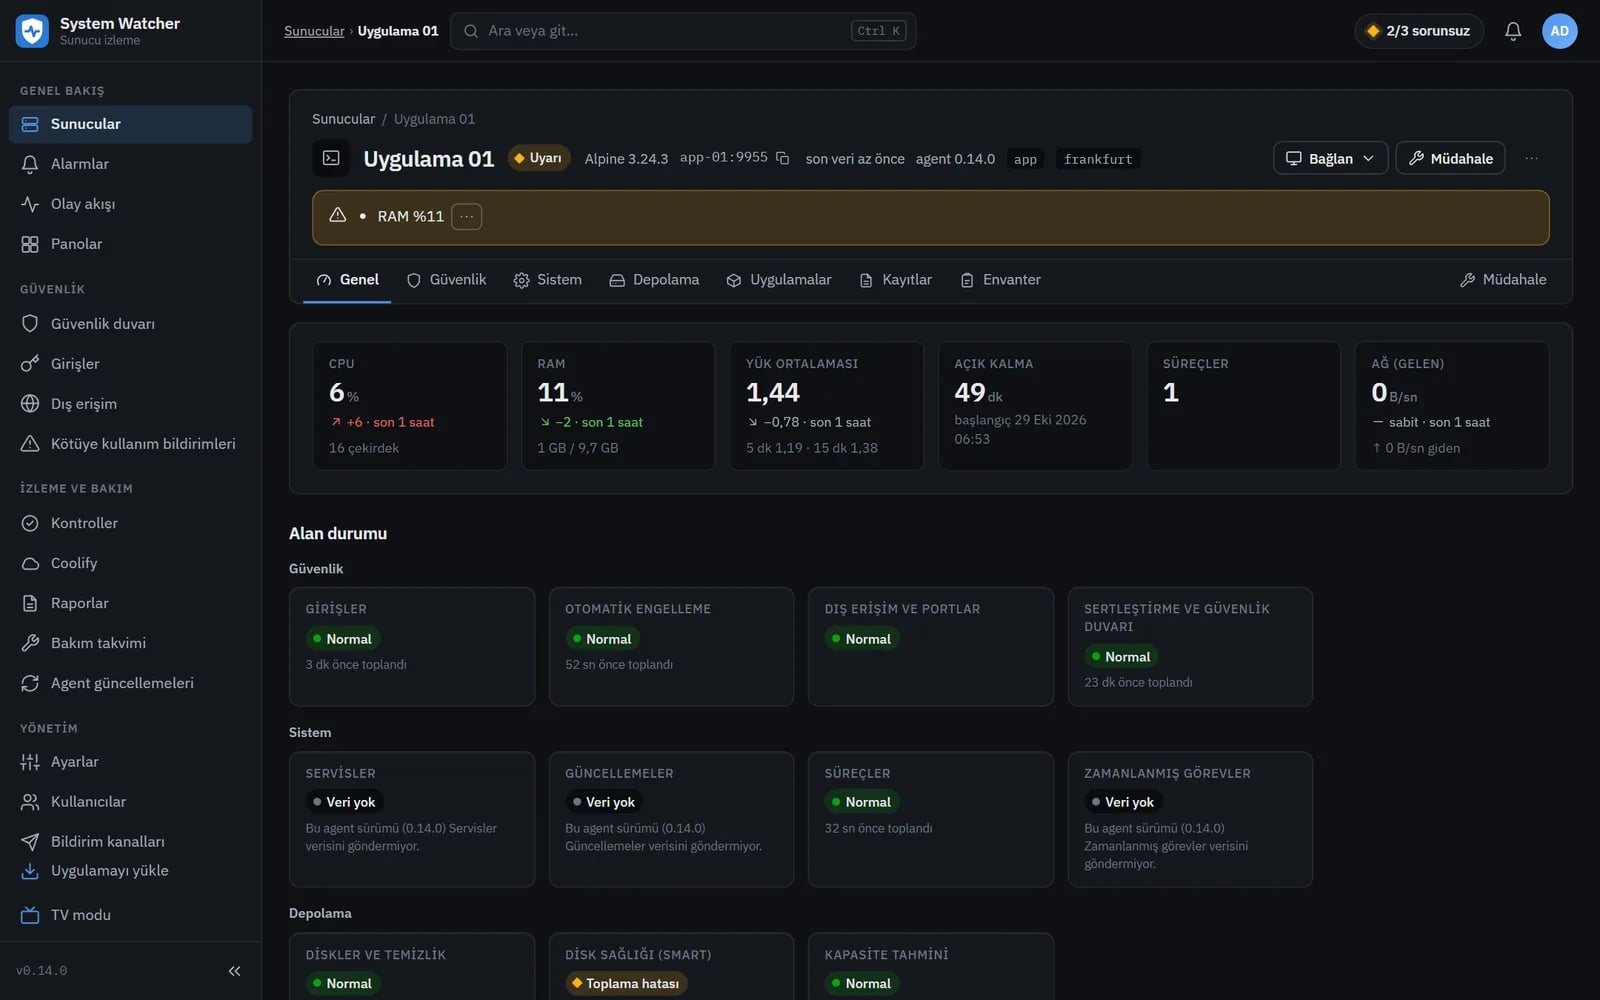
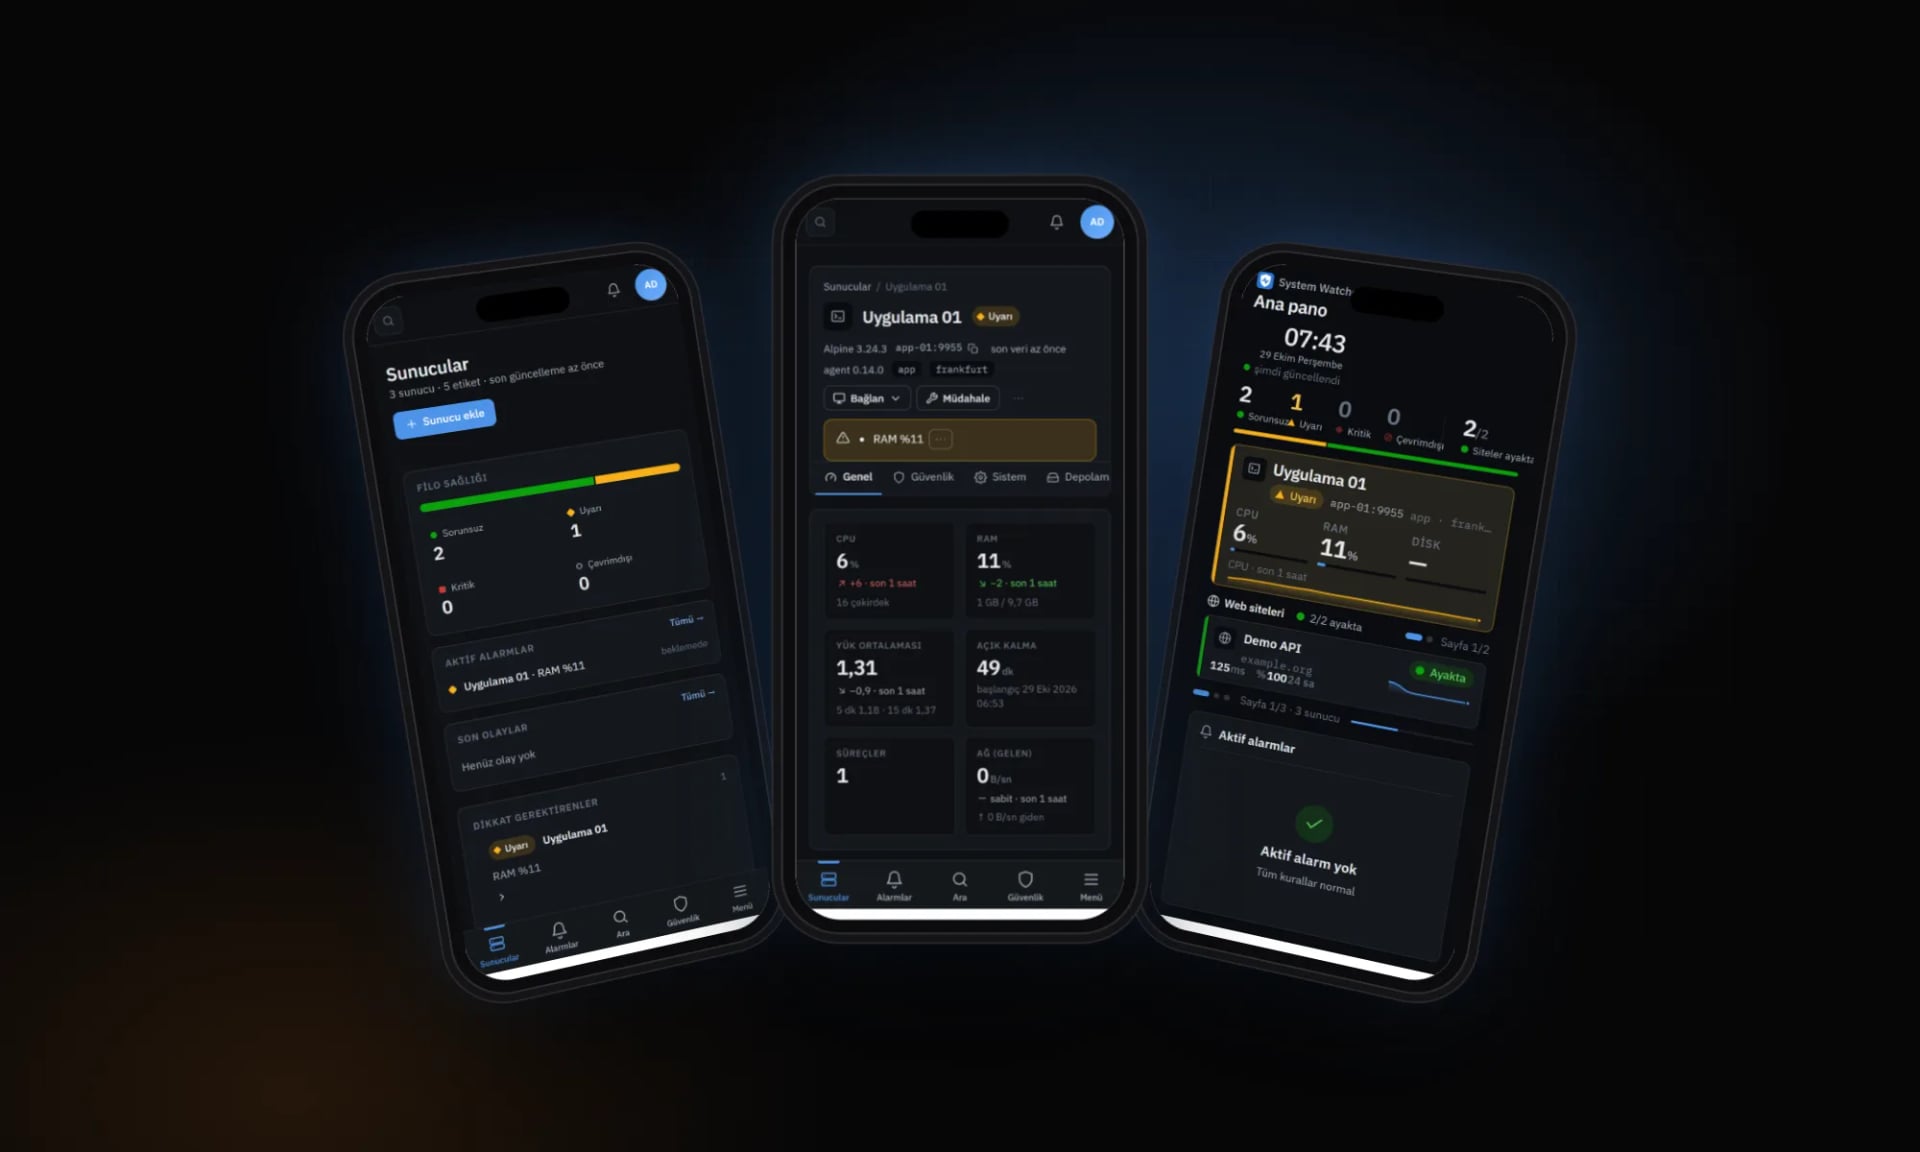
The servers we maintain run in different cities, different data centres and on different operating systems. We did not want to learn about a full disk, a stopped service or a brute-force attempt on SSH only after the problem had grown. So we built System Watcher for our own operations: a small Go agent runs as a service on each server and collects metrics, and a hub pulls that data over Tailscale’s encrypted private network, stores it in SQLite and presents it in a React interface. The agents are never exposed to the internet. As an internal tool it is not public and still in development; the screenshots here were taken locally with three demo servers running in Docker containers.
Screens
A closer look
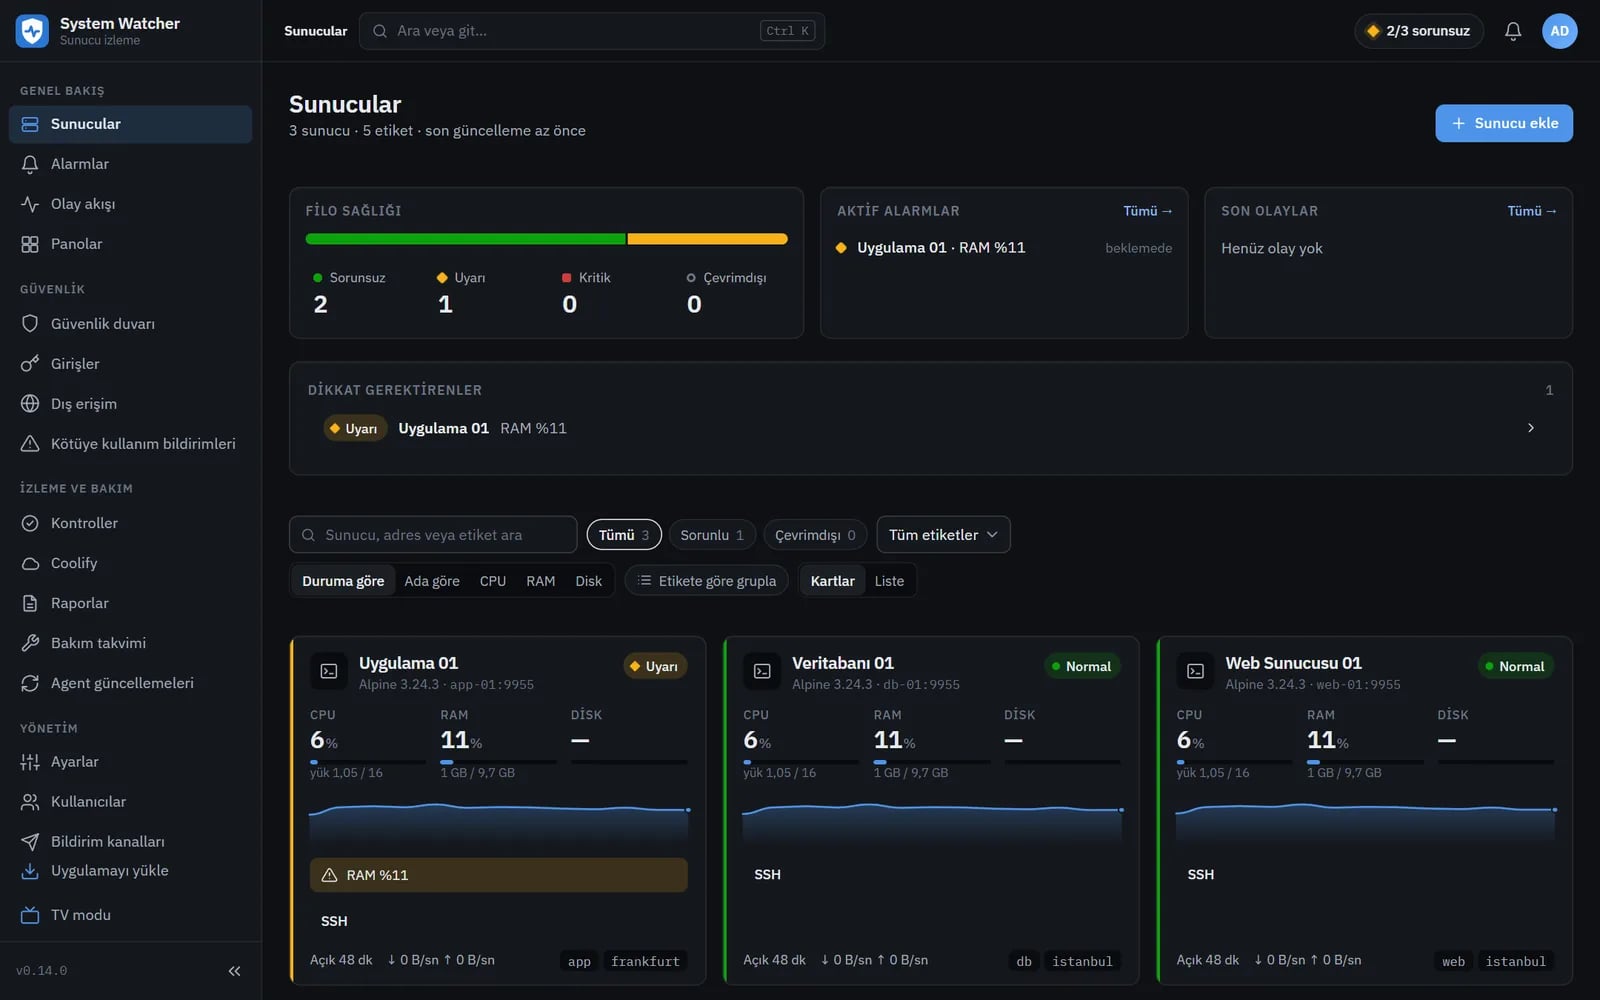
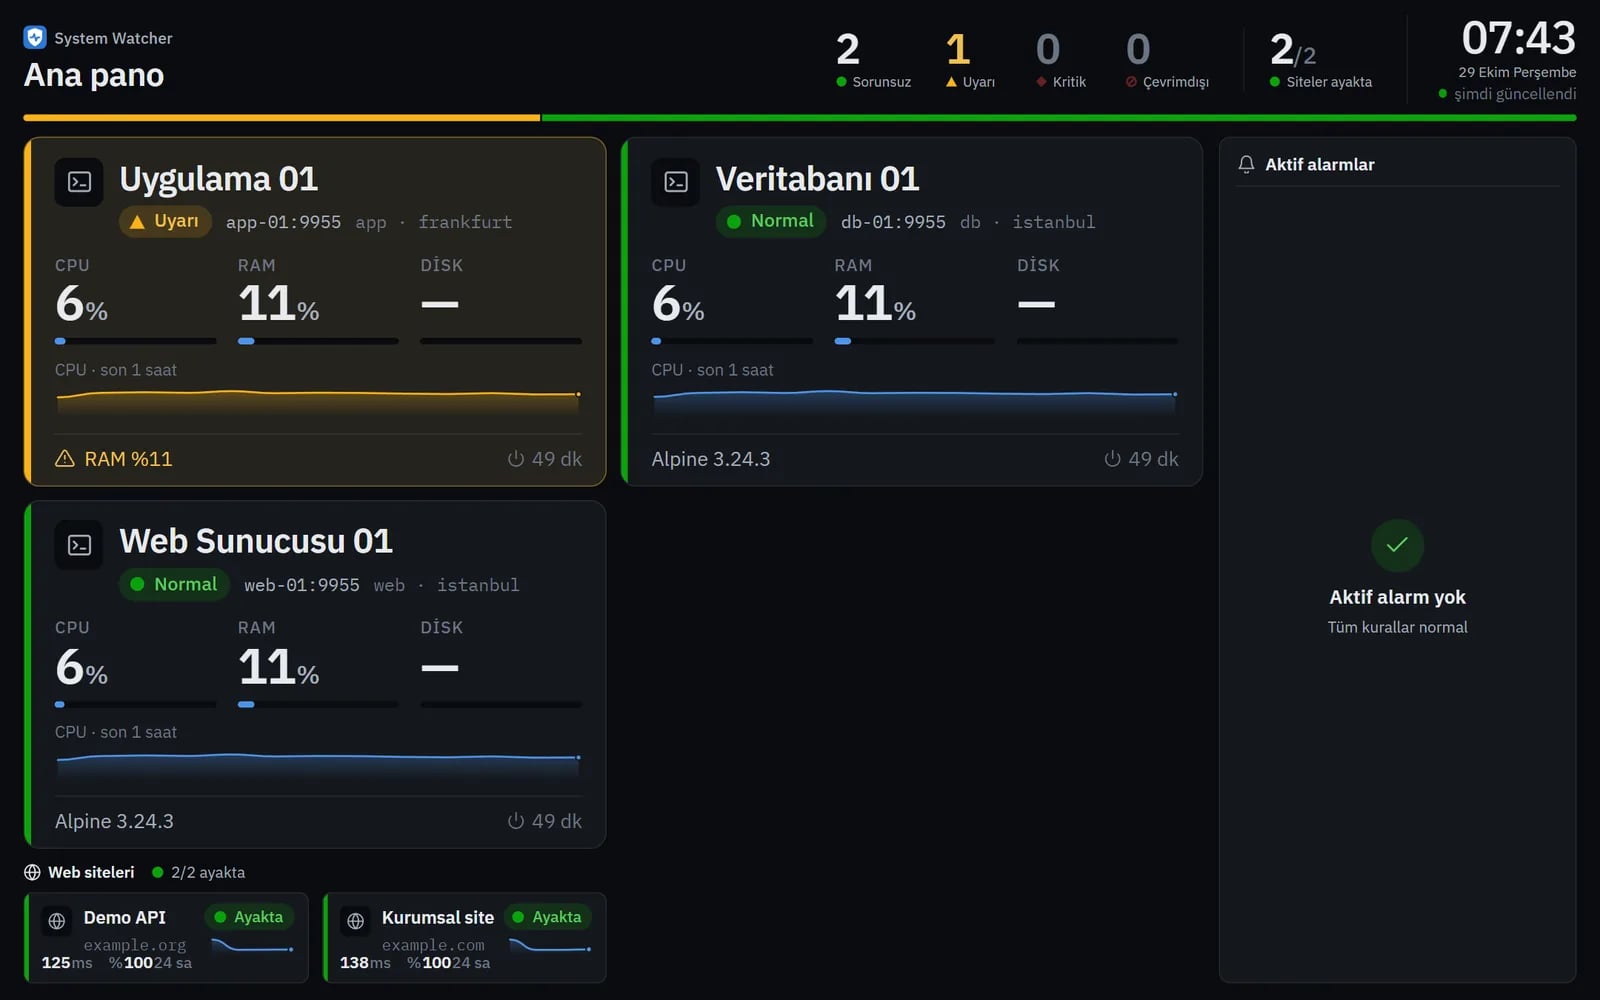
Fresh screenshots from the live site: the full page, inner pages and how it looks on a phone.
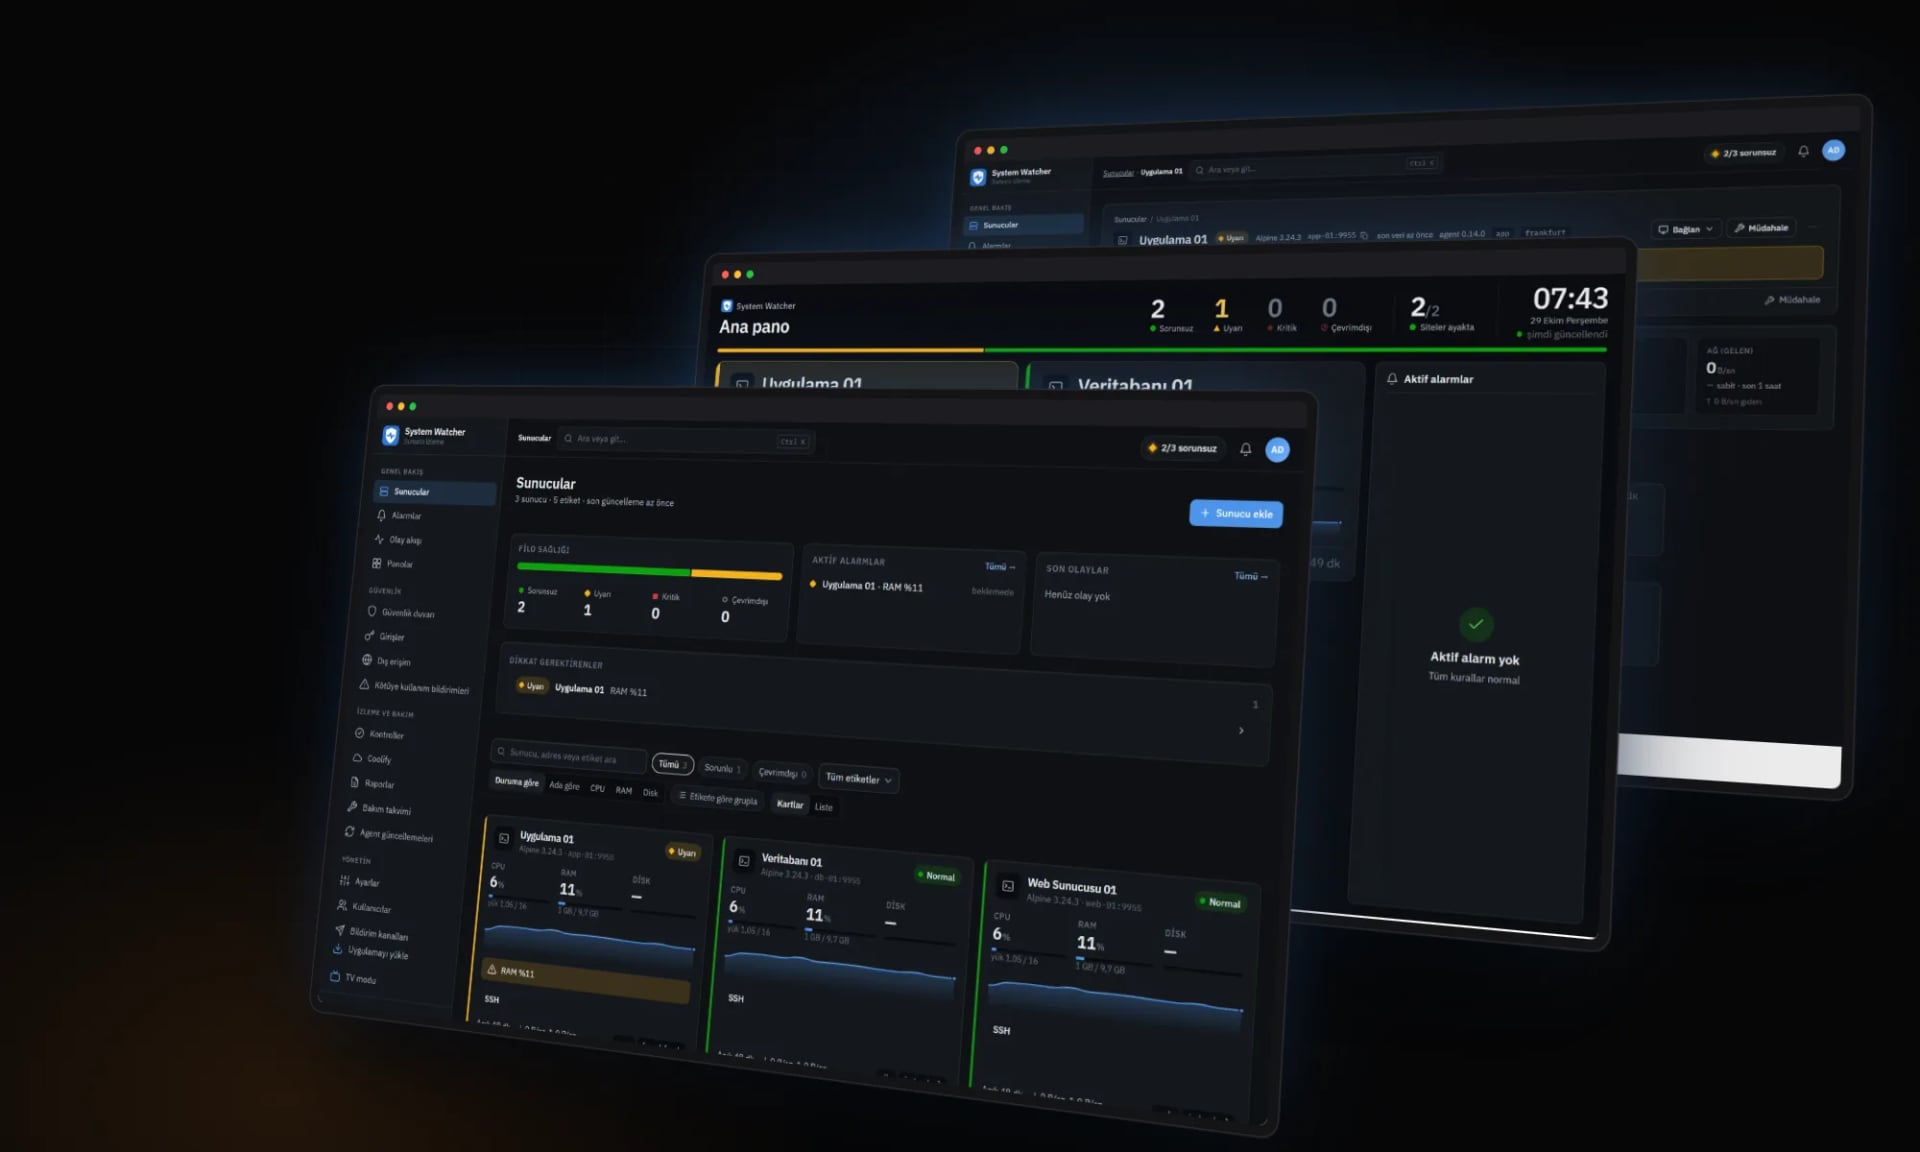
Sections and inner pages
02 /
Approach
Three decisions that shaped the project.
An agent closed to the internet
By default the agent listens only on its Tailscale address, and its read-only API is protected by a token. The one-line install command is single-use: it downloads the agent, verifies it with SHA-256, installs it as a service and registers the server with the hub on its own.
Data that survives downtime
The agent keeps the last 24 hours of measurements in memory, so any gap while the hub was offline is backfilled from that buffer once it returns. Raw data is kept for 7 days, minute summaries for 90 days and hourly summaries for 2 years.
Alerts without the noise
Default thresholds are 80% for warning and 90% for critical, adjustable per server. Alerts can be acknowledged and muted during maintenance; an unacknowledged alert escalates through defined steps to Telegram, email, webhooks or push notifications on a phone.
03 /
What we delivered
- Fleet dashboard with CPU, RAM, disk, network and uptime
- Windows services, systemd units and pending updates
- RDP/SSH sessions, failed logins and brute-force detection
- SQL Server backups, Docker containers and Coolify application status
- Disk-full forecasts and capacity charts
- HTTP, SSL certificate, domain expiry and ping checks
- TV mode for wall displays and in-browser remote desktop
Tech stack
- Go
- React 19
- TypeScript
- Vite
- Recharts
- SQLite
- Tailscale
- Docker
- Apache Guacamole
- Web Push
Services
The code and the domain belong entirely to our client.
Next project
A—57
canturan.dev
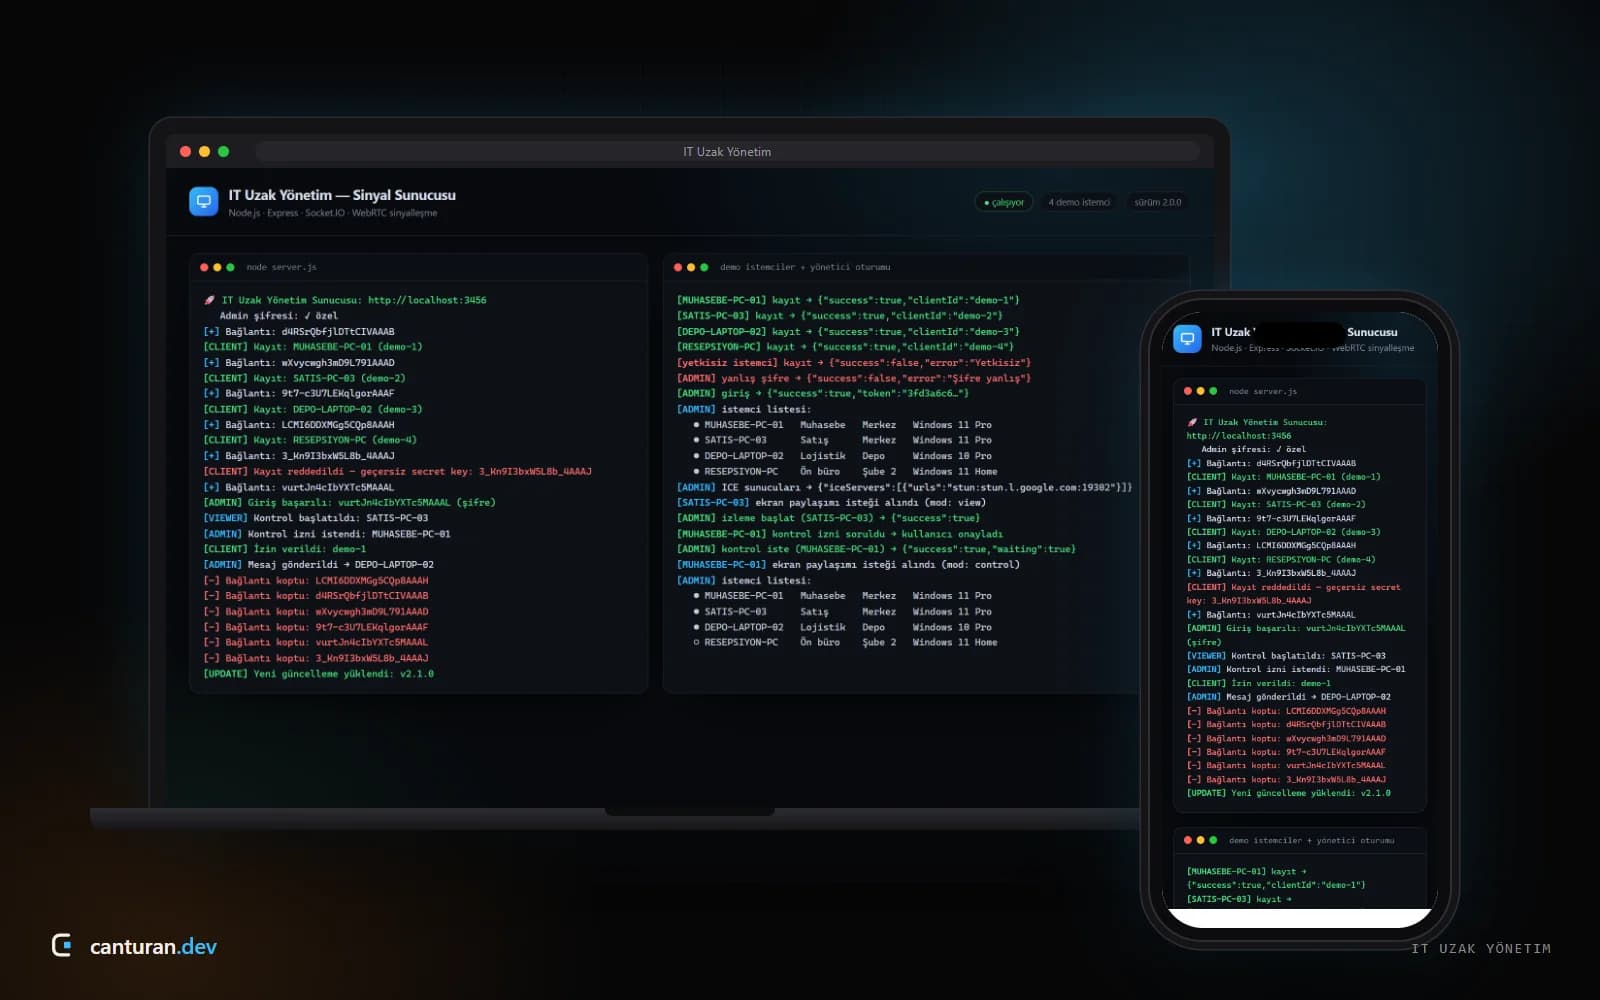
The signalling server behind a remote support system that only takes control with the user’s consent
Personal brand · Türkiye